Study of the geological and morphological evidences of the Tyrnyaus mudflow of 2000 as well as eyewitness testimonies allows reconstruction of the rheological and hydrodynamics parameters of the flow in connection with characteristics of deposited sediments. Revealed regularities can be applied for reconstruction of the parameters of the paleoflows deposited gravel-conglomerate sequences over the world.
Key words: mudflow, conglomerate, paleoreconstruction.
Introduction
In the 2000 several catastrophic mudflows had place in the Baksan valley of Caucasus region near the Tyrnyauz settlement (fig.1) as the result of long intensive rain and fast melting of the mountain glaciers.
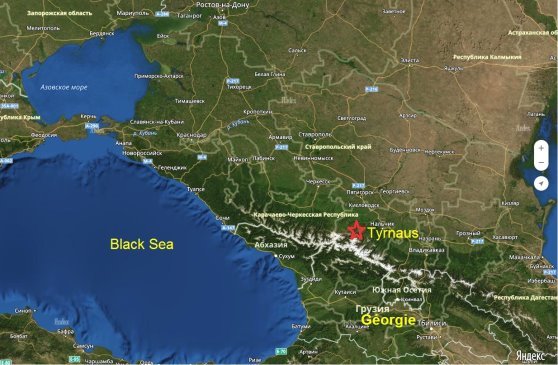
Fig.1. The area of the Project research: north slope of the Central part of Caucasus Mountain System, Baksan valley, Tyrnyaus settlement (using Yandex Map)
Several episodes of mudflow descent were recorded. The mudflows produced an approximately 800-m-long fan with the thickness approximately 5 meters.
Research of the conditions of the present-day mudflows allows providing the necessary data for reconstruction of the paleohydraulic conditions of deposition of the gravel-conglomerate formation.
1. Substantiation of the research
Gravel and conglomerate deposits are usual components of sedimentary sequences. Depending of transgressive or regressive regime of sedimentation the conglomerate has lower (initial) or uppermost (terminal) position. As well as the waters of the basin advance initial conglomerate change to sand, silt and carbonate deposits, when the water retreats fine deposits change to coarse gravel and conglomerate. Therefore, position of conglomerate in the sedimentary sequence indicates the character of regressive cycle the conglomerate has lentil structure according to principle of Golovkinsky [1].
The conglomerates are results of high activity of the water environment. In the present-day conditions the conglomerates form in the valleys and in the piedmont of the mountain area in the result of mudflows and floods.
Ancient conglomerates had another nature. Whereas Cenozoic conglomerates usually are of the same nature of the present-day ones, Mesozoic and Paleozoic conglomerates have sheet character and cover the erosion surface on extensive areas. There are no similar landscapes on the Earth now. Only Okavango-delta basal conglomerates in the South Africa can provides the geological situation similar to the ancient cover conglomerates.
Well-rounded pebbles and boulders of the conglomerate deposits are evidence of high energy hydrodynamic conditions. Conglomerate allows determination not only quality but also quantitative characteristics of the hydrodynamics. Numerous geological engineering investigations [2, 3, 4, 5] and many others determined dependence of the flow conditions (velocity, depth, hydraulic regime) and dimension of the carried sediments.
The mudflows forming the conglomerates have both deposition and erosive activity. In the initial zone of the mudflow formation it erodes and drags friable slope sediments and partly consolidated bedrock layers. As the velocity of the flow and capability decrease the superfluous volume of the sediments deposit in the surrounding territory.
Researching of the present-day mudflow parameters allow revealing of the connection between the velocity, density, depth of the flow, slope of the bottom of the channel, geological and geomorphological conditions of the mudflow area etc. with granulometry constitution, lithology and structure of the deposited conglomerates. Knowledge of these regularities provides possibility to solve an opposite problem — to make the reconstruction of the paleo mudflow parameter based on the lithology, structure and granulometruc composition of the gravel and conglomerate deposits.
2. Object of the research
In the 18–24 July of 2000 several catastrophic mudflows had place in the Baksan valley of Caucasus region near the Tyrnauz settlement as the result of the intensive rain and fast melting of the mountain glaciers in the upper mountain part of Gerkhogansy Gorge.
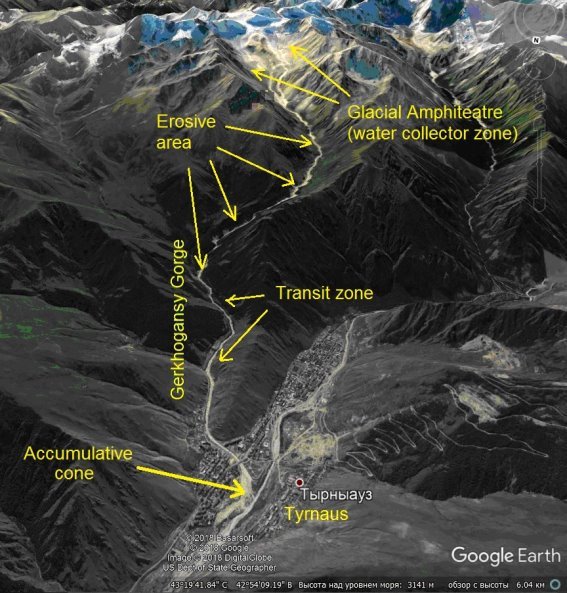
Fig. 2. View on the Tyrnyauz Settlement and Gerkhogansy Gorge that produced the mudflows and lithodynamic zoning of the gorge (using Google Earth Pro)
During the week before the first blow intensive four days rain and followed fast melting of glaciers. It produced several catastrophic mudflows in Gerkhogansy Gorge that enter to Baksan valley near the Tyrnauz Settlement. Six episodes of mudflow descent were recorded, and each episode lasted approximately half an hour. Observations and preliminary calculation reveal that velocity of the flow was 6–10 m/s with specific sediment discharge of 4 m 3 /s/m.
Total square of the Gerkhogansy valley with the tributaries is 78 km 2 with the river length 15 km. Research of the map, cosmic photos, digital relief and field ride observations of the Gerkhogansy gorge reveal that the gorge has standard structure and consists of four zones (Fig. 2):
2.1 Water collector zone, “glacier amphitheatre” (upper part) of the valley is the area of the permanent (or long living) glaciers, snow firn fields and collector of rain water. It locates on the altitude 2.7–3.8 km. The square is approximately 21 km 2 including 9.5 km 2 area of glacier and sustainable snow cover (fig. 3). Dry collector beneath the snow area consists of numerous small water channels which gather in the center of the glacial amphitheatre. Coefficient of filtration (share of the water arriving to surface flow in a short time) is 0.87 for snow cover and 0.5 for dry collector. Clay content of the deposits of dry collector is approximately 10 %.
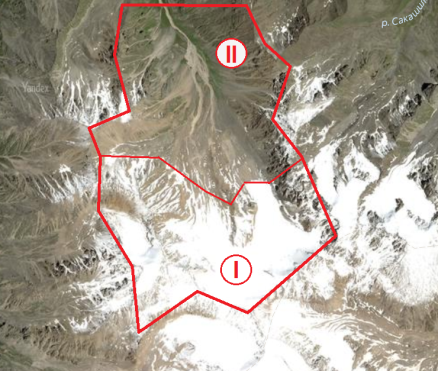
Fig. 3. Upper part of Gerkhogansy Gorge — water collector zone; 8.6–15 km from the mouth (cosmic photo). I — glacier and sustainable snow area; II — dry water collector area (using Yandex Map)
2.2 Erosion zone that locates below “water collector zone” is main provider of clastic material for the mudflow. This part of the valley consists of friable slope and moraine sediments which are represented by clayey-sand mix with the boulders and big blocks that roll down from the surrounding slopes. Thickness of friable deposits is more than 50 m. This zone has not glaciers, so arriving of addition portions of water occurs due to rains only. Slopes of this zone are partly woody; therefore the rain water precipitated in this zone came to main river channel with some delay and has minor influence in the mudflow forming process. Coefficient of filtration is 0.2.
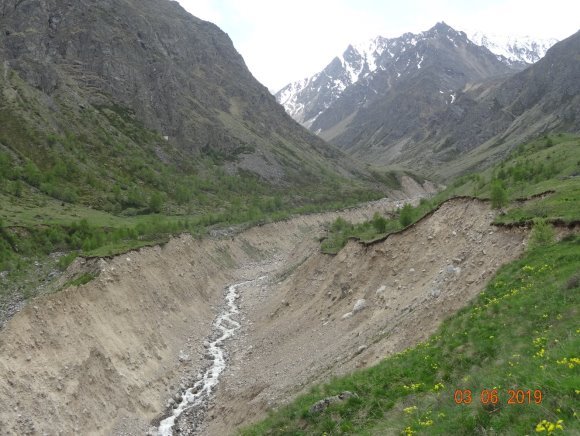
Fig. 4. Moderate erosion ravine (8–10 km from the mouth)
During the peak of rain and glacial melting periods when the flow parameters reach of the critical value, the sediments in this zone began intensively eroded and provides main part of clastic material. Eroded valley has V-shape with width 80–120 m and depth 15–45 m.
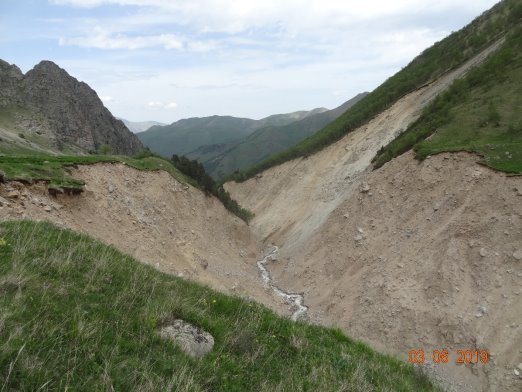
Fig. 5. Intensively eroded middle part of V-shape ravine (5.2–8.6 km from the mouth)
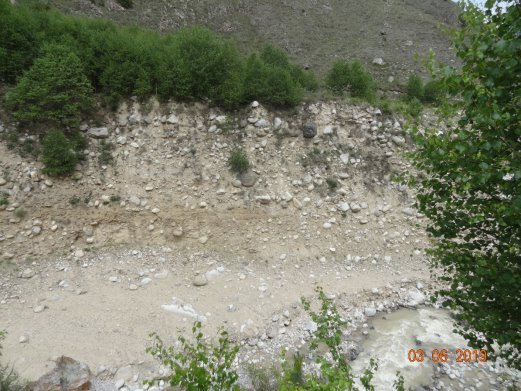
Fig. 6. Sedimentological constitution of eroded deposits
Eroded deposits consist of the sand gravel mix (clay content is approximately 25 %) with boulders up to 0.5–1.0 m (30–40 %) (fig.6). Big blocks larger than 1 m rolls to the bottom of canyon from the surrounding slopes.
2.3 Transit zone. When available volume of water reaches maximum saturation by debris and clay material, the character of the mudflow became stable (transit zone). In dependence of changing of the bed inclination, the transit conditions can alternate with moderate erosion. Abundant rainfall compensates with retaining of the water by soil, therefore coefficient of filtration is 0.15. Clay content in eroded sediments is 33 %.
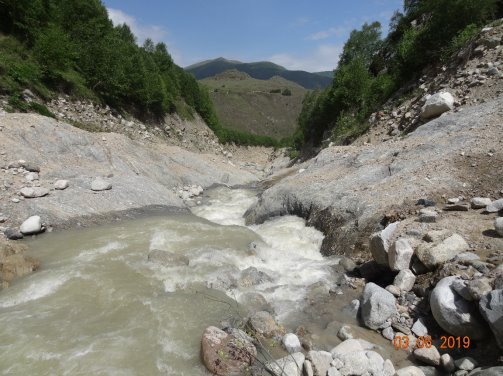
Fig. 7. Transit zone (1–5 km from the mouth).
2.4 Accumulative zone. The sedimentation of the clastic material begins when the velocity and capacity of the mudflow decrease. It could be in the widening of the valley, flattening of the bottom or entering of the tributary on the main valley. Most coarse blocks and boulders deposit in the beginning of the zone, smaller boulders and gravel deposit in the distal part. In the extremely end when the velocity decrease to zero, the sand-clay sediments deposited. Average clay content in the deposited sediment is 5–10 %.
Thus, real parameters of the mudflow (velocity, capacity etc.) can be reconstructed in the end of erosion and transit part of the accumulative cone taking into account largest parts of the clastic material.
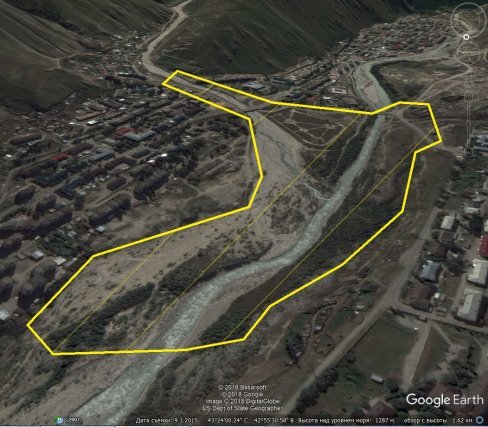
Fig. 8. Accumulative zone (0–1 km from the mouth) (using Google Earth Pro)
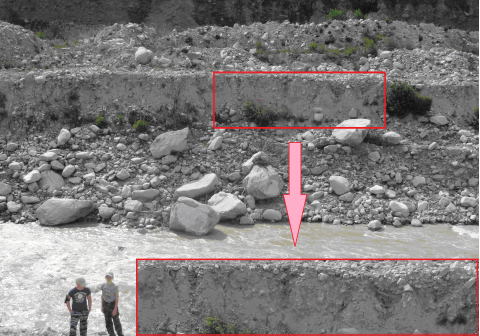
Fig. 9. Sedimentological constitution of accumulated deposits
3. Method and algorithm of the investigation
For the calculation of the mudflow characteristics we need to research and estimate the next parameters:
- Research of the weather condition (temperature of the air and duration of the rain) and duration of the mudflow episode with the documents and eyewitnesses.
- Volume of the water precipitated from the rain and melting from the glaciers. It is possible taking into account:
− square of the collecting zone (main factor) and erosion zone (minor factor);
− intensity of the rainfall;
− intensity of the snow/glacier melting.
- Estimation of the volume of eroded material in the different lithodynamic and morphological parts of the gorge, calculation of the parameter of specific erosion.
- Estimation of the volume of accumulative cone resulted from the mudflow.
- Research of granulometric composition of eroded deposits (average and maximal size of the clasts, content of clay).
- Calculation of the mudflow parameters.
3.1 Research of the weather condition
The temperature of the air and duration of the rain were researched with the observations of the Tyrnauz meteorological station report and published description of the mudflow conditions.
Duration of the permanent rains period was approximately 4.5 days. Average precipitated rain water was 79 mm/24 hours, up to 140 mm/ 1.5 hours in the extreme period.
Maximal temperature in Tyrnauz reaches 28°C, whereas average month temperature before the mudflow was 15.6°C. Taking into account vertical gradient of the temperature decreasing, in the glacier/snow area average day-night temperature was approximately 2°C (upper border) to 6°C (low border) (average 4°C) whereas maximal reaches 16–22°C. The most temperature was observed on July 14–23, 2000 [6].
Total duration of the mudflow episode by the documents and eyewitnesses was 3 hours (6 episodes each of 0.5 hours).
3.2 Volume of the water precipitated from the rain and melting from the glaciers
Taken into account the squares of the zones from cosmic photos, intensity of rain 79 mm/day, duration of permanent rains 4.5 days and coefficients of filtration according to Kurganov [7], we can calculate volume of the rain and melting water in the different zones of Gerkhogansy gorge (table 1).
Table 1
Calculation of the volume of rain water in the different zones arriving directly into mudflow
|
Zones |
Squire |
Intensity of rain |
Duration |
Coefficient of filtration |
Volume of rain water |
|
km 2 |
mm/day |
days |
m 3 |
||
|
Glacier |
9.5 |
79 |
4.5 |
0.87 |
2 938 208 |
|
Dry collector |
11.5 |
79 |
4.5 |
0.50 |
2 044 125 |
|
Erosion |
16 |
79 |
4.5 |
0.20 |
1 137 600 |
|
Transit |
41 |
79 |
4.5 |
0.15 |
2 186 325 |
One of the components of runoff in the mountains is meltwater. The fallout of rain water on melting snow, first, brings additional heat, and, secondly, contributes to the destruction of snow particles and faster filling of small pores, i.e. reduces the time before the start of the return of water from the snow.
The amount of melt water h T is most simply expressed as a function of the sum of positive air temperatures (if there is a sufficient supply of water in the snow cover) through the melting coefficient k as follows:

where t is the time when the forecast was made; i is the number of days from the moment when the air temperature passed through 0°C; Ɵ i + — positive air temperatures [8].
A calculation method has been developed that allows taking into account both of the above-mentioned circumstances. Water output from snow cover is calculated using the formula that includes the parameter, characterizing the water-holding capacity of snow:

where q T — receipt of melt water, m 3 /s; h T — layer of melt water, mm; ε H — water-retaining the snow capacity, according to the literature data, is assumed to be on average equal to 0.13 (so, coefficient of filtration is 0.87) [8].
Snow humidity ε(t) is calculated using the expression:

where X 1 (t) is the amount of melt water in the snow cover; t is the day sequence number for which are to be calculated. Water recovery from snow begins from the moment when it humidity reaches the critical value of ε H .
The decrease in snow cover during the thaw can be determined by the sum of positive average daily air temperatures multiplied by the snow melting coefficient, which is within 2.5–5.5 mm / °C, depending on the degree of forest cover in the basin. The amount of meltwater that comes from glaciers is calculated at k , equal to 9 mm/(°C day). This takes into account the area of simultaneous snowmelt.
Runoff reaches its maximum values on the first day of the flood, during which about 45 % of its volume formed by the daily rain passes. In the case of long rains (more than 4–5 days) porous of the ground are saturated of water and the coefficient of filtration is approximately constant.
Taken into account square of the glacier and sustainable snow cover as 9.5 km 2 , sum of the temperatures above 0°C as 4°C x 4.5 days=18.0, k=9 mm/(°C day), volume of melting snow can be estimated as approximately 1.54 million (mln) m 3 . Total volume of rain and melt water is shown in the table 2:
Table 2
Calculation of the volume of total water taken part in the mudflows in different zones
|
Zones |
Volume of rain water |
Volume of melt water |
Total cumulative volume of water |
Duration of mudflows |
Coef. of mudflow water |
Water discharge in zone |
Cumulative water discharge |
|
mln m 3 |
mln m 3 |
mln m 3 |
s |
m 3 /s |
m 3 /s |
||
|
Glacier |
2.94 |
1.54 |
4.48 |
10800 |
0.45 |
187 |
187 |
|
Dry collector |
2.04 |
0 |
6.52 |
10800 |
0.45 |
85 |
272 |
|
Erosion |
1.14 |
0 |
7.66 |
10800 |
0.45 |
47 |
319 |
|
Transit |
2.19 |
0 |
9.85 |
10800 |
0.45 |
91 |
410 |
3.3 Volume of eroded sediments
Volumes of eroded and accumulated material were estimated during field research and study of the cosmic photos and digital relief. It allows determination of both total volume of eroded material (m 3 ) and specific erosion (m 3 /m) of the 1 m of the length of the channel. It is necessary take into account that the ravine began forming before the mudflow of 2000. Detail research of the morphology of the ravine indicated that depth of erosion of mudflow 2000 was approximately 0.7 of the total depth of the ravine.
Parameters of erosion structure (ravine) are represented in the table 3. Volumes of eroded sediments were determined on the geomorphologically homogeneous parts of the ravine.
Longitudinal profile of the gorge and lithodynamic conditions are illustrated on the Fig. 10.
Table 3
Parameters of erosion of the mudflows- 2000 in different zones
|
Zone |
DM. m |
L. m |
W. m |
DR. m |
DE 2000. m |
ShR |
VE m 3 |
SE m 3 /m |
SE average |
CVE m 3 |
|
|
from |
to |
||||||||||
|
CW |
8620 |
9680 |
1060 |
40 |
4 |
2.8 |
rectangle |
119 |
0.1 |
0.10 |
119 |
|
E |
8020 |
8620 |
600 |
80 |
15 |
4.2 |
triangle |
252 |
0.4 |
||
|
7640 |
8020 |
380 |
95 |
25 |
3.5 |
410 |
1.1 |
||||
|
6820 |
7640 |
820 |
100 |
40 |
1.4 |
1550 |
1.9 |
||||
|
6450 |
6820 |
370 |
80 |
20 |
14.0 |
408 |
1.1 |
||||
|
6150 |
6450 |
300 |
100 |
25 |
17.5 |
289 |
1.0 |
||||
|
5200 |
6150 |
950 |
90 |
20 |
24.5 |
599 |
0.6 |
1.01 |
3625 |
||
|
T |
4200 |
5200 |
1000 |
60 |
2 |
31.5 |
rectangle |
84 |
0.1 |
||
|
2700 |
4200 |
1500 |
40 |
5 |
19.6 |
210 |
0.1 |
||||
|
2000 |
2700 |
700 |
50 |
6 |
10.5 |
147 |
0.2 |
||||
|
800 |
2000 |
1200 |
40 |
4 |
2.8 |
134 |
0.1 |
0.14 |
4201 |
||
Notes. Zones: C –collector of water, E — erosion, T — transit.
DM — distance from mouth, L — length, W — width, DR — depth of the ravine, DE 2000 — depth of erosion of 2000, ShR — transversal shape of the ravine, VE — volume of erosion, SE — specific erosion of the river channel (m 3 /m of the length of the channel), CVE — cumulative volume of eroded material down to the flow.
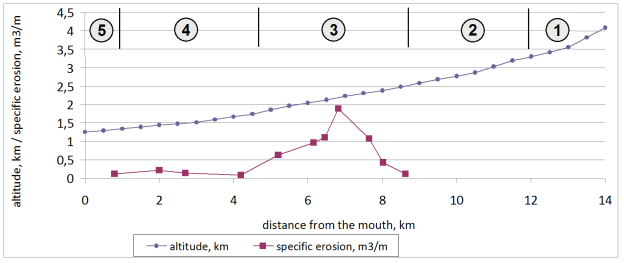
Fig. 10. Profile and lithodynamic conditions of the Gerkhogansy gorge: 1 — longitudinal altitude profile of the river-bed; 2 — specific erosion of the river channel (m 3 /m of the length of the channel); 3 — hydrodynamic zones: 1 — glacier; 2 — dry collector zone; 3 — erosion; 4 — transit + moderate erosion; 5 –accumulative
3.4 Determination of rheological characteristics of the flow
Table 4 illustrates calculation of the characteristics of the flow which are important for calculation of rheological parameters of the liquid phase and characteristics of the mudflow.
Table 4
Characteristics of the mudflow
|
Zones |
Cumulative water volume from table 2 |
Cumulative sediment volume from table 3 |
Solid phase in fluid (Cv) |
Density of the fluid* |
Clay content in the fluid** |
Width of the channel |
Specific water discharge |
Specific sediment discharge |
|
mln m 3 |
m 3 |
% |
t/m 3 |
% |
m |
m3/s/m |
m 3 /s/m |
|
|
Glacier |
4.48 |
|||||||
|
Dry collector |
6.52 |
119 |
3.9 |
1.06 |
0.4 |
80 |
3.4 |
0.1 |
|
Erosion |
7.66 |
3625 |
51.3 |
1.85 |
12.8 |
90 |
3.5 |
3.7 |
|
Transit |
9.85 |
4102 |
48.7 |
1.80 |
16.1 |
60 |
6.8 |
6.5 |
Notes. * Density of the fluid was calculated with the density of solid phase 2.65 t/m3. ** Clay content in the fluid was calculated with the clay content in the deposits 10 % for water collector, 25 % for erosion zone and 33 % for transit zone.
Rheological characteristics of debris flow (non-Newtonian fluid, hyperconcentrated flow). Data presented in Table 4 suggest that in the erosion and transit zones the mudflow has properties of non-Newtonian fluid, which is characterized by the following specific property: this medium behaves as a solid body below a certain load known as yield stress ( τ 0 ) and acquires properties of liquid only when the load exceeds this limit. According to [4], the lower limit of the content of solid phase in fluid, at which the flow acquires properties of the non-Newtonian liquid, varies from 10 to 40 %. At that the same time, the significant share (20 vol % or more of the solid phase) of clay component sufficiently increases the viscosity and changes rheological characteristics of the flow.
Properties of the non-Newtonian liquid are described by the Bingham–Shvedov equation:
τ = τ o + μ m (dVx/dZ), (4)
where dV x /dZ is the rate of flow velocity deformation along Z axis.
Yield stress of the Bingham liquid is defined by equation obtained in laboratory experiments with different mixtures of liquid and solid phases [2]. In the case of high content of clay fraction in the solid phase (up to 20–30 %), the equation takes the form
τ o = 0.1 е 23 (Сv — 0.05) (5)
where C v is the volume concentration of solid phase (sedimentary material) in flow.
Coefficient of dynamic viscosity of the fluid containing mud–clay fractions (μ f ) is defined by equation:
μ f = μ (1 + 2.5 C v + е 23 (Сv — 0.05) ), (6)
where μ is the coefficient of dynamic viscosity of pure water.
Volume of the clay fraction determines the character of the mudflow. If the content of the clay fraction is more than 10 %, the mudflow has coherent character: water and clay form homogeneous mix with sand, pebbles and boulders which has heightened erosion and carrying ability. This mix has conditions of non-Newtonian fluid. Taken the clay content in the fluid from table 4, the mudflow fluid has non-Newtonian character certainly. It flows down with the velocity of 4–10 m/s and eroding friable sediments of the valley and even hard bed-rock.
Non-coherent debris flow occurs when the clay content is less than 10 %. In this case, the fluid has Newtonian character. Erosion and carrying ability of the flow is sufficiently less than for coherent flow.
The character of the mudflow constitution can change if the tributaries bring new portion of the water without clastic material. In this case the coherent mudflow can change to non-coherent.
Density of the mudflows was estimated in the limits of 1.5–2.3 t/m 3 [9]. It corresponds to the density determined in our calculation as 1.80–1.85 t/m 3 (table 4).
Thus, the available data allow us to calculate the shear stress for the Tyrnyaus mudflow. The content of solid phase in the flow is taken as 42 % (C v = 0.42), coefficient of dynamic viscosity of water ( μ ) at 20ºC is 1.0·10– 3 , and the degree of flow velocity deformation dVx/dZ = 80, because it is evident that the mudflow had increased clay content (viscosity) and high intensity. The calculated value of τ o is equal to 496 Pa and μ f = 3.14. From Eq. (4), one can obtain the value of shear stress equal to 894 N/m 2 . The high share of the τ o value (56 %) in the total value of τ confirms the non-Newtonian nature of the fluid.
Approximately the same values of shear stress of the same order (from 200 to 1000 N/m 2 ) were obtained by Lord and Kehew [10] during calculations of parameters of the hyperconcentrated flow formed after breakthrough of the Regina Glacial Lake in the southeast of Saskatchewan.
Additional confirmation of non-Newtonian character of the flow is obvious from the photo of the mudflow protection dam (Fig. 11). Blocks of rocks up to 1.5 m were lodged in the semi-permeable dam on the altitude 2–4 m. Non-coherent flow can roll big blocks, but never carry in the suspension. At the same time, the mudflow rolls the blocks up to 3–4 m in diameter which were deposited as the Gerkhogansy gorge enter into Baksan valley (Fig. 12).
Also, visual confirmation of the rheological characteristics of the fluid is possible to obtain from the Video of the Tyrnyaus mudflow. On the 10–12 and 18 minute the mudflow float big blocks of the rock on the surface of the flow (and roll, also). (push “Ctrl” button and click the link below two times (double click) for the video activation).
https://yandex.ru/video/preview/?filmId=10669305963064613015&text= %D1 %81 %D0 %B5 %D0 %BB %D0 %B5 %D0 %B2 %D0 %BE %D0 %B9 %20 %D0 %BF %D0 %BE %D1 %82 %D0 %BE %D0 %BA %20 %D0 %B2 %20 %D1 %82 %D1 %8B %D1 %80 %D0 %BD %D1 %8B %D0 %B0 %D1 %83 %D0 %B7 %D0 %B5 %202000&noreask=1&path=wizard&parent-reqid=1581505613735082–600020726282466683200111-vla1–2221&redircnt=1581507252.1
It confirms that the flow had non-Newtonian character of the fluid with share stress 894 N/m 2 with yield stress 496 Pa.
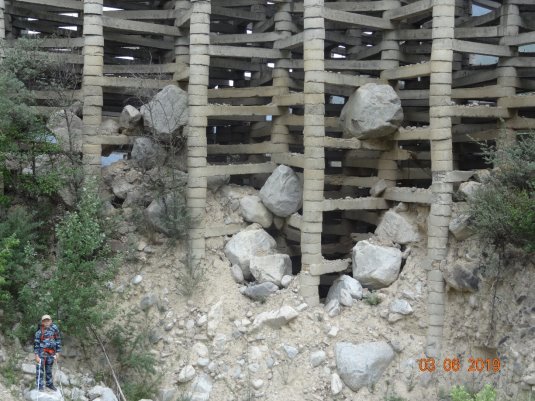
Fig. 11. Blocks of the rocks up to 1.5 m in diameter, lodged in the semi-permeable dam on the altitude 2–4 m
4. Interpretation of the obtained results
Obtained results of the research of geomorphology of Gerkhogansy gorge, lithology of eroded and accumulated sediments as well as rheological characteristics of the mudflows allow reconstruction of the mudflow 2000 occurrence.
4.1 Erosion
In the zone of water collector erosion has moderate activity — specific erosion is approximately 0.10 m 3 per 1 m of the channel length, with specific water discharge 3.4 m 3 /s/m, density of the fluid 1.06 t/m 3 and clay content less than 1 %.
While in the erosion zone specific water discharge is approximately of the same value 3.5 m 3 /s/m, density of the fluid and clay content sufficiently rise up to 1.85 t/m3 and 12.8 % correspondingly that result to increasing of erosion ability to 1 m 3 /m.
Developing of the erosion can be observed by comparison of the two photos near broken dam of 1999 and after 2000 years. The dam was destroyed by ordinary mudflow in 1999 (one year after building).
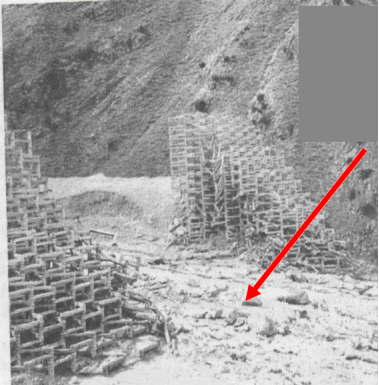
Fig. 12. Surface of the gorge near the protection dam in 1999 after the dam was broken by ordinary mudflow. The channel was not eroded. http://hnu.docdat.com/pars_docs/refs/193/192138/img6.html
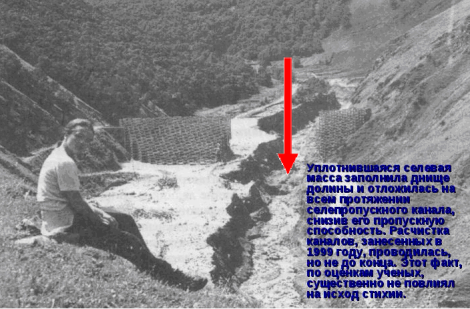
Fig. 13. Erosion channel appeared after the mudflow of 2000.
http://hnu.docdat.com/pars_docs/refs/193/192138/img7.html
On the photo of 1999 there is no erosion of between two remnants of the dam (Fig. 12). On the photo after 2000 (exact date is unknown) erosion channel appeared (Fig. 13).
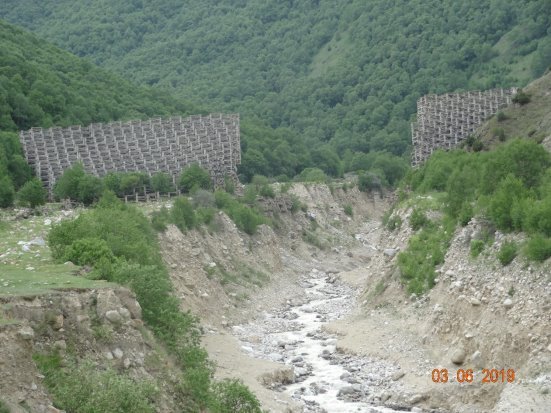
Fig. 14. Erosion channel in 2019
Whereas depth of the eroded channel is 12 m (Fig. 14), it is possible to estimate the mudflow erosion ability of friable clastic deposits with intensities of 2.0 m/hour in conditions of specific sediment discharge 3.7 m 3 /s/m, density of the fluid 1.85 t/m 3 and clay content in the fluid 12.8 % (table 4).
Dependence of erosion ability of mudflow vs. density of the fluid was researched by [11] on the mudflows of Central Caucasus. It reveals that the erosion reached maximum with density of the fluid of 1.4 t/m 3 with flowed decrease to zero at density 2.5 t/m 3 (Fig. 15).
At the density of 1.85 t/m 3 erosion ability is approximately 2 m/hour that has correspondence with our research of the Gerkhogansy mudflow of 2000.
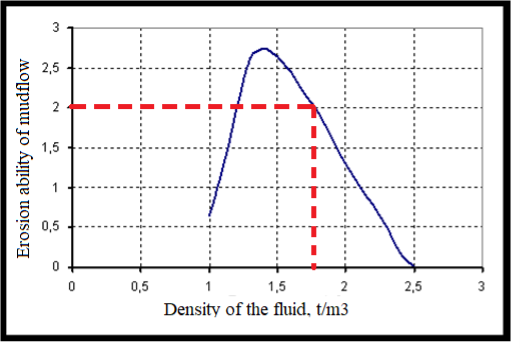
Fig. 15. Graph of erosion ability of mudflow vs. density of the fluid after [11]
4.2 Transportation
Transport ability of non-Newtonian (hyperconcentrated) fluid has nonlinear dependence from the velocity of the flow and density of the fluid. In the case of the fluid density 1.8 t/m 3 , content of solid phase in fluid 48.7 % and clay content 16.1 % (estimated shear stress is approximately 894 N/m 2 ) blocks of the rocks up to 1.5 m are in suspension and up to 4 m (Fig. 16) moved as bedload. In this case, specific sediment discharge is 6.5 m 3 /s per 1 m width of the channel.
4.3 Accumulation
Arriving of the mudflow into Baksan valley result to increasing of the width of the channel and decreasing of the slope of the bed and velocity of flow. It results to deposition of the carried clastic material in accumulation cone. This cone crosses the Baksan valley and made the dam which stopped Baksan river and create temporary lake. Measured volume of the cone is 2.4 mln m 3 .
As the capacity of the flow decrease, most coarse blocks and boulders deposit in the beginning and middle part of the zone, smaller boulders and gravel deposit in the distal part. When the velocity decrease to zero, in the extremely end the sand-clay sediments deposited. Average clay content in the deposited sediment is 5–10 %.
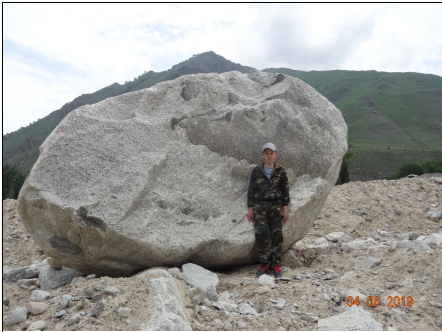
Fig. 16. Granite block transported by mudflow, deposited in the middle part of the accumulative cone
Estimated volume of eroded material (4.2 mln m 3 , table) is approximately 1.8 times more than measured volume of the cone. Apparently, it is result of some removal of the mudflow material by Baksan river down to the valley. This applies primarily to sand and clay material that flow down when coarse material was deposited. I result to content of clay in accumulation cone is much less than in mudflow (5–10 % in comparison with 16 % in mudflow). This gives us the basis for an important conclusion that clay content in ancient conglomerates is undervalued in relation to the fluid. Therefore, reconstruction of hydraulic parameters of paleoflows with determined clay content in the matrix give lower value in comparison with real fluid up to 1.5–3 times.
Conclusions
- Research of the present-day mudflows (on the example of mudflow of 2000 in Gerkhogansy gorge near Tyrnauz settlement in Baksan valley) allows determination of the flow parameters with geological environment and characteristics of the sediments.
- Calculation of the volumes of rainfall and show melting water taking part in the mudflow as well as volumes of eroded sediments allows estimation of the fluid characteristics in different zones of mudflow forming morphostructure: volume of solid phase in fluid reaches 50 %, clay content — 16 %, density of the fluid — 1.8 t/m 3 with specific sediment discharge 6.5 m 3 /s/m and shear stress is approximately 894 N/m 2 . Observed velocity of the mudflow was 4–10 m/s.
- It is comparable with estimated parameters of paleoflows: Upper Jurassic conglomerates of Crimea (specific sediment discharge 11–22.5 m 3 /s/m with critical share stress τ c = 564 N/m 2 ) [12], and parameters of the hyperconcentrated flow formed after breakthrough of the Regina Glacial Lake in the southeast of Saskatchewan ( τ c = 200–1000 N/m 2 ) [10].
- Obtained values of hyperconcentrated flow are sufficient for carrying in suspension blocks of the rocks up to 1.5 m and rolling in bedload up to 4 m.
- Clay content in accumulated mudflow deposits is sufficiently less (from 1.5 to 3 times) than in the mudflow fluid because liquid phase migrates down to the valley when coarse sediments (conglomerate and gravel) were deposited. It is necessary to take into account in reconstruction of hydraulic parameters of paleoflows with determined clay content in the matrix.
- Obtained results can be applied for research of ancient conglomerate and gravel deposits for reconstruction of the paleoflow parameters.
References:
- Golovkinsky N. About the Permian formation in the central part of Kama-Volga basin. Proceedings for geology of Russia. Imperial St.-Petersburg Mineralogical Society. Vol.1, 1869. P.275–408.
- Julien, P.Y., Erosion and Sedimentation , New York: Cambridge Univ. Press, 1995.
- Lebedev, V. V. Hydrogeology and Hydraulics in Bridge Road Building. Leningrad: Gidrometeoizdat, 1959.
- Mulder, T. and Alexander, J., The Physical Character of Subaqueous Sedimentary Density Flows and Their Deposits, Sedimentology, 2001. Vol. 48. P. 269–299.
- Pierson, T.C. and Costa, J.E., A Rheological Classification of Subaerial Sediment-Water Flows, in Debris Flows/Avalanches: Process, Recognition and Mitigation , Geol. Soc. Am. Review Engineer. Geol., 1987. Vol. 7. P. 1–12.
- Khadjiev M. M. Estimation of mudflow risk for Tyrnyaus region. Nalchik, 2005. 17 p.
- Kurganov A. M. Tables of parameters of the maximum intensity of rain for determining discharges in water disposal systems. Moscow: Stroyizdat, 1984. 109 p.
- Mukhin V. M. Methodological bases of physical and statistical types short-term forecasts of mountain river flow. Hydrometeorological research center of the Russian Federation. 2008. 36 p.
- Zaporogchenko E. V. Engineering protection of mudflow activity in the BAksan valley // Proceedings of North Caucasus institute of melioration. V.17., 2007. Pyatigorsk. P.37–45.
- Kononova N. K., Malneva I. V., Seinova I. B. Circulation character of mudflow forming process in conditions of degradation of glaciation in Central Caucasus. Proceedings of glaciation researches. V.102. P.154–160.
- Lord, M.L. and Kehew, A.E., Sedimentology and Paleohydrology of Glacial-Lake Outburst Deposits in Southeastern Saskatchewan and Northwestern North Dakota, Bull. Geol. Soc. Am. , 1987. Vol. 99. P. 663–673.
- Lalomov A. V. Reconstruction of paleohydrodynamic conditions during the formation of Upper Jurassic Conglomerates of the Crimean Peninsula // Lithology and Mineral Resources, 2007. Vol. 42. No. 3. P. 268–280.


